


Meet Asha, a marketing manager spends hours trying to spot trends in campaign data, yet critical customer insights still slip by unnoticed. In another office, Ravi, a financial analyst, is buried under weekly reports and market news, afraid he’s missing warning signs of the next big market shift. Dr. Meera, an experienced physician, struggles to keep up with the flood of medical journals and patient records, worrying that important clues for a diagnosis might be lost in the noise. These professionals share a common challenge – data overload.
We’re drowning in data but starving for insights. One report found 78% of people feel bombarded with more data, and 86% say this tsunami of data has overwhelmed traditional analysis methods.
The consequences are clear: professionals struggle to extract timely insights from their data. Valuable signals get buried in the noise, and by the time traditional analysis flags an important trend, the opportunity window has often closed.
This is where AI comes in as an analytics accelerator.
Artificial Intelligence (AI) can sift through mountains of information in seconds, helping professionals like Asha, Ravi, and Dr. Meera transform data overload into clear, actionable insights. In this article, we’ll explore how analytical intelligence accelerated by AI enhances productivity and decision-making for professionals, and how you can start leveraging these tools in your own work.
So, what is analytical intelligence?
In simple terms, analytical intelligence is the ability to break down complex problems and find out logical solutions to them. For example, when a marketer dissects why a campaign failed, or a doctor correlates symptoms to diagnose a patient, they’re using analytical intelligence. It’s a core part of human cognition; psychologists describe it as the facet of intelligence involved in reasoning and problem-solving.
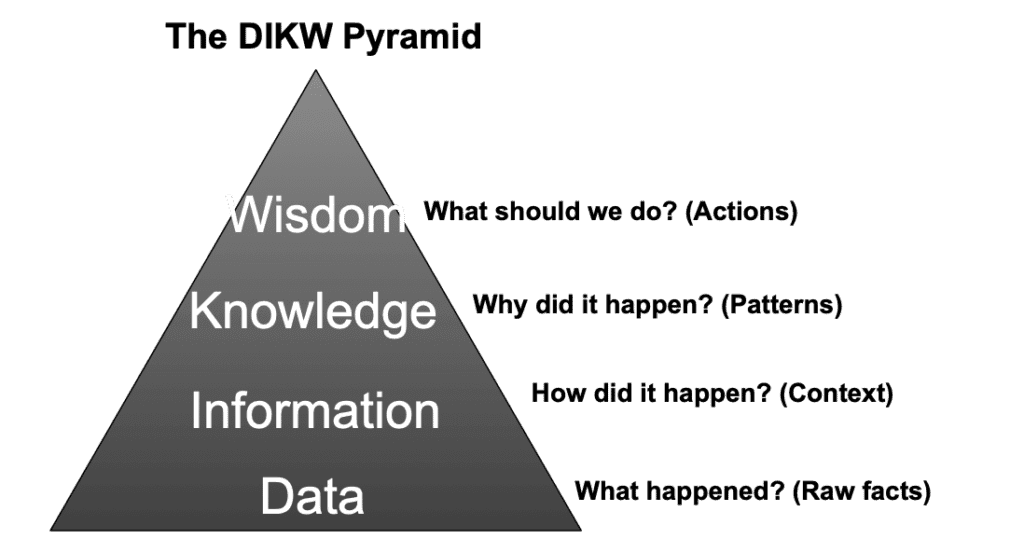
In practice, this means evaluating data (numbers, facts, observations), identifying what’s relevant, and drawing conclusions. This journey from data to insight is often illustrated by the classic “DIKW” pyramid – moving from Data to Information to Knowledge to Wisdom. Having analytical intelligence means being able to climb this pyramid effectively: you don’t just collect data, you interpret it (information), understand what it means (knowledge), and apply it to make smart choices (wisdom).
Analytical intelligence is a mindset that questions assumptions (“Is this customer trend a seasonal blip or a real shift?”) and digs deeper for root causes. In different professions, this can take many forms. Whenever you pause, analyze the facts, and use logic to decide a course of action, you’re exercising analytical intelligence.
- For a marketer, it’s analyzing campaign metrics and customer behavior to figure out which strategy worked and why.
- For a doctor, it’s examining lab results and patient histories to deduce a diagnosis.
- For an engineer, it might mean troubleshooting a system failure by methodically testing hypotheses.
Strong analytical intelligence lets a professional turn raw data into a coherent story or decision.
Evolution of Analytical Intelligence: From manual reports to AI-powered insights
- 1960s-1980s: Early Days of Data & BI In the mid-20th century, businesses began using computers for basic data processing. The 1980s saw the first data warehouses (large databases) emerge to store and organize business data. Analytics was manual and centralized, including printed reports, simple databases, and analysts crunching numbers with early software (even hand calculations back in the 60s).
- 1990s: Rise of Personal Computing & Spreadsheets As PCs and tools like Excel became common, individual professionals started doing their own analysis. Business Intelligence (BI) software gained traction, enabling canned reports and dashboards. Still, most analysis was backward-looking (descriptive) and time-consuming to prepare.
- 2000s: Big Data and Advanced Analytics The internet and digitization led to an explosion of data volume. New technologies (like Hadoop in 2005 for distributed data processing) enabled storing massive “big data” sets. Advanced analytics and data mining techniques grew, allowing pros to find patterns in larger datasets. Companies began investing in analytics teams and tools for forecasting and optimization.
- 2010s: Self-Service, Real-Time, and AI Pilots Analytics became more democratized. Tools like Tableau and Power BI let non-IT staff visualize data easily. Real-time data streaming and dashboards started giving up-to-the-minute info. Machine learning entered the scene, e.g. predictive models that could forecast trends or classify customers, though often handled by data scientists. Early AI-driven analytics assistants appeared, but on a limited scale.
- 2020s: AI-Powered Analytical Intelligence Today, we’re in the era of augmented analytics where AI is embedded in many tools. AI can automatically find insights (e.g. anomalies, correlations) and even explain them in plain language. From AI chatbots that answer data questions, to predictive algorithms in software that continuously learn and improve, professionals now have “co-pilots” for decision-making. Analytics is faster, more proactive, and more accessible than ever, enabling a marketer to get instant trend alerts or a doctor to receive AI-driven diagnostic suggestions in real time.
Five common barriers blocking your analytical insights
If tapping into data is so powerful, what holds professionals back? In practice, many hurdles can throttle your analytical intelligence at work:
1. Data preparation nightmare
Have you ever spent an entire afternoon just trying to get your data ready for analysis? You’re not alone.
Think about your last important presentation. How much time did you spend actually analyzing the data versus hunting for the right files, cleaning up spreadsheets, or copying numbers between systems? For most of us, preparation consumes most of our time.
A marketing director I worked with tracked her activities for a week and discovered something shocking: she spent nearly 12 hours collecting and preparing data, but only 2 hours actually analyzing it and making decisions. “I feel like a data janitor, not a strategist,” she told me.
Studies confirm this experience is universal – the average professional spends about 30% of their workday just gathering information. That’s 2.5 hours every day spent before any actual analysis happens. By the time you’ve finally got everything ready, the opportunity to act might already be gone.
2. Information overload and decision fatigue
“I have 15 dashboards, 27 weekly reports, and an inbox full of analytics. I know the answer is somewhere, but I can’t see the forest for the trees anymore.”
That’s how a frustrated operations manager described his situation to me. When everything seems important, nothing is. Your brain has a finite capacity for processing information, yet modern work environments bombard us with endless metrics, reports, and data points.
This overwhelming flood of information triggers what psychologists call “analysis paralysis” – a state where more data actually makes decision-making harder, not easier. A recent study found that 72% of business leaders admit there are times when data overwhelm has completely stopped them from making decisions.
If you’re postponing action for “more analysis,” the chances are you will end up making no decision at all.
3. The disconnected data problem
Many professionals struggle to see “the full picture” because data lives in different places. Customer feedback might be in survey tools, sales numbers in a CRM, finances in another system; none of them talking to each other.
With data spread across disconnected silos, it’s hard to combine insights. You might only get a partial view of a problem, missing the context available in another dataset. A salesperson, for instance, might see only their CRM notes but not the customer’s support tickets that explain recent dissatisfaction.
Without a unified view of your data, you’re always working with an incomplete picture, like a doctor trying to diagnose a patient while only seeing some of the symptoms.
4. The gut-feeling fallback
When data is hard to access or understand, we naturally fall back on experience and intuition. It’s human nature.
“I know what the report says, but my gut tells me we should go in a different direction,” said a product manager during a feature prioritization meeting. Despite clear user research indicating customers wanted feature A, he pushed for feature B based on his personal conviction.
While experience is incredibly valuable, our intuition comes with built-in biases, systematic errors in judgment that we’re often unaware of. For once, we tend to remember dramatic examples more than representative ones. This becomes a problem as we give too much weight to information that confirms what we already believe. In a nutshell, we always overestimate our ability to predict outcomes.
A Harvard study found that 92% of professionals believe they’re more objective than their peers: a statistical impossibility that reveals how blind we are to our own biases.
5. “Always too late” problem
In today’s fast-moving business environment, week-old data might as well be ancient history.
A digital marketing team I worked with would optimize their campaigns weekly based on performance reports. By the time they made adjustments, they had already spent thousands of dollars on underperforming ads. “It’s like driving by looking only in the rearview mirror,” their director explained.
This timing gap between when events happen and when you get information about them creates a perpetual cycle of reaction instead of proactive management. Real-time insight isn’t just a nice-to-have luxury, it’s the difference between preventing problems and cleaning up after them.
The limitations become particularly acute when dealing with:
- Unstructured data: Images, text, audio, and video that contain valuable information but resist traditional analytical methods
- Complex interrelationships: Analyzing how multiple variables interact across different timescales and contexts
- Forward-looking analysis: Predicting future outcomes and optimal interventions rather than merely describing past events
- Real-time requirements: Generating insights within operational timeframes measured in seconds or minutes rather than days or weeks
How AI is the answer to your analytics bottlenecks?
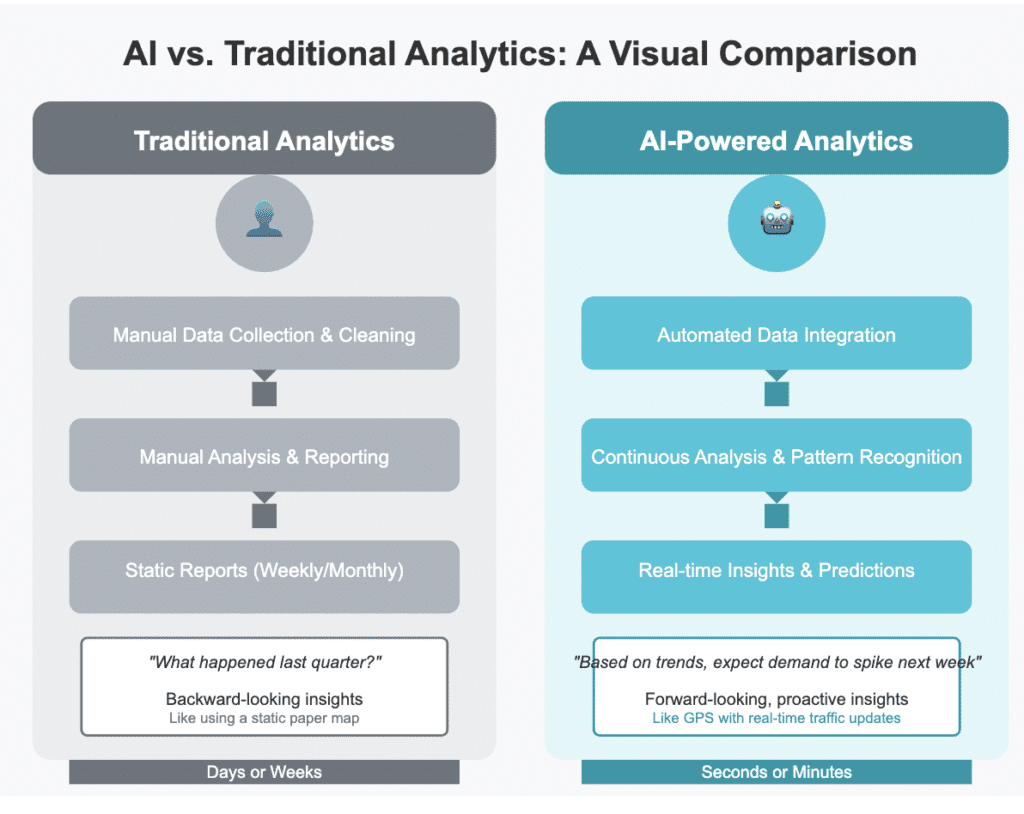
Unlike traditional methods where you manually pull reports and hunt for insights, AI automates the heavy lifting—collecting, cleaning, and analyzing data—so you can focus on making decisions rather than preparing spreadsheets.
AI doesn’t just make analytics faster—it makes it fundamentally different. We’re moving from tools that answer questions we ask to systems that tell us what questions we should be asking in the first place.
Here are some ways AI technologies accelerate analytics:
1. Data preparation automation
Problem: Cleaning and preparing data for analysis is one of the most time-consuming parts of analytics. AI-driven data preparation tools automate data cleaning, standardization, and merging from multiple sources. These tools identify missing values, remove duplicates, and even suggest transformations without requiring manual intervention.
Tools That Help:
- Trifacta – Uses AI to automatically detect and correct data inconsistencies, missing fields, and incorrect formats.
- Talend Data Fabric – Merges data from multiple sources, handling cleansing and enrichment automatically.
- Microsoft Power Query (built into Excel & Power BI) – Identifies patterns in raw data and suggests transformations, reducing the need for manual data processing.
Real-World Example: A marketing team at a large e-commerce company used Trifacta to clean customer purchase data from three different platforms (Shopify, Salesforce, and an internal CRM). Before AI, analysts manually cleaned datasets, a process that took 20+ hours weekly. After implementing AI-powered data prep, data integration and cleansing were fully automated, cutting the process to 2 hours per week, ensuring cleaner data for campaign analysis.
Implementation tip:
✅ Start small. Identify one high-value data pipeline that requires frequent manual cleaning and use an AI-powered tool to automate it. For example, if your finance team spends hours reconciling sales and payment data from different systems, deploy a tool like Talend to streamline the process.
2. AI-Powered Anomaly Detection
Problem: Finding anomalies (fraud, unusual trends, operational bottlenecks) in huge datasets is like finding a needle in a haystack. Traditional analytics often relies on pre-set thresholds (e.g., flagging transactions above a certain amount), but this approach misses subtle anomalies that might indicate emerging problems. AI-powered anomaly detection systems continuously scan key metrics, learning normal patterns and flagging anything unusual—even patterns you wouldn’t have known to look for.
Tools That Help:
- Amazon Lookout for Metrics – AI-powered anomaly detection for business KPIs, integrates with databases like Snowflake, Google BigQuery.
- Anodot – Real-time anomaly detection for financial data, sales trends, and IT infrastructure.
- Microsoft Azure Anomaly Detector – Detects anomalies in streaming data for businesses monitoring real-time metrics.
Real-World Example: A finance department at a multinational bank deployed Anodot to monitor transaction data across its global network. Previously, fraud analysts reviewed flagged transactions manually, catching only about 60% of fraudulent activities in time. Once AI was introduced, Anodot detected suspicious transactions within milliseconds, flagging fraudulent activity before payments were processed, improving fraud detection rates by 40% and preventing millions in losses.
Implementation tip:
✅ Start with one high-risk metric. For example, deploy AI anomaly detection on your customer churn rates or suspicious login activity in IT security before rolling it out to other areas.
3. Natural Language Query Interfaces
Problem: Non-technical professionals often struggle with data tools that require SQL, dashboards, or complex filters. They rely on analysts to fetch insights, causing bottlenecks when quick decisions are needed. AI-powered Natural Language Processing (NLP) query interfaces allow users to ask questions in plain English and receive immediate insights, without requiring coding skills.
Tools That Help:
- Google BigQuery with NLP – Allows users to type questions like “What were sales last quarter?” and get instant answers.
- Tableau Ask Data – Enables users to type queries like “Show me revenue by region” and generates charts automatically.
- ThoughtSpot – AI-driven search analytics tool where business users can ask data-related questions in simple language.
Real-World Example: The HR team at a Fortune 500 company struggled to access data insights from their HR analytics dashboard. The process required analysts to manually pull reports, delaying insights. After implementing ThoughtSpot, HR professionals could simply type “Which teams have the highest turnover this quarter?” and receive an instant answer. This reduced report turnaround time from 2 days to 5 minutes, leading to faster HR decision-making.
Implementation tip:
✅ Introduce an NLP-based BI tool in a department where quick answers are frequently needed (e.g., sales or HR). Train non-technical employees to use it for one common use case, such as querying sales performance or workforce retention data.
4. Automated Report Generation: AI That Writes Insights for You
Problem: Data teams spend hours each week creating reports, summarizing trends, and writing insights for management. This manual process delays decision-making. AI-powered automated report generation tools summarize trends and generate key takeaways automatically, saving hours of manual effort.
Tools That Help:
- Narrative Science (Quill) – AI-driven reports that turn raw data into executive summaries.
- Microsoft Power BI Smart Narratives – Auto-generates text summaries of key analytics trends.
- Google Data Studio + Natural Language Generation – Writes real-time data insights into reports.
Real-World Example: A sales team at a SaaS company adopted Microsoft Power BI Smart Narratives to generate weekly performance summaries. Before AI, sales managers manually compiled reports, consuming 6+ hours per week. Now, AI-generated reports highlight key trends (e.g., “West Coast leads increased by 12%, conversion rates dropped by 4%”). This cut down reporting time by 80% while providing faster, data-driven insights.
Implementation tip:
✅ Start by automating just one recurring report (e.g., weekly sales reports, performance summaries). Choose an AI tool that integrates with your existing BI platform to gradually reduce manual reporting workloads.
Practical applications of AI-powered analytics intelligence for different professionals
Here’s how AI is changing the game of intelligence in various roles:
For marketers
Marketers using AI are seeing real benefits: one study found that using AI for personalized content increased conversion rates by over 130% for new customers.
Use cases:
- AI can automatically segment customers into precise groups by analyzing behavior and demographics, uncovering niches that a marketer might overlook.
- It can also personalize campaigns at scale – for instance, an AI system can analyze each customer’s browsing and purchase history to recommend the product or message they’re most likely to respond to.
Imagine an AI that looks at millions of data points (web clicks, past purchases, social media engagement) and then tells you, “these 5,000 customers are likely to be interested in Product X, and here’s the best message and channel to reach them.” It’s like having a data-savvy marketing analyst on your team, running continuously.
Recommended tools and platforms
- Google Analytics Intelligence (which uses AI to answer questions about your website/app data and find anomalies automatically)
- Adobe Sensei (built into Adobe’s marketing suite for things like AI-driven customer segmentation and product recommendations)
- Hootsuite Insights for social media (which uses AI to analyze social trends and sentiment). Email marketing services like Mailchimp and Constant Contact now have AI features to optimize send times and subject lines
- If you work with ads, platforms like Facebook Ads have AI-driven optimization (e.g., dynamic creative that automatically finds the best ad combination for each audience)
- For content marketing, AI writing assistants (like Copy.ai or Jasper) can help draft copy based on analytics of what performs well, and AI image tools can even generate on-brand graphics.
- Many marketing analytics dashboards (like Datorama and Tableau) incorporate AI to highlight important changes in KPIs so you don’t miss them.
For financial analysts
In finance, AI analytics acts as an early warning system and a crystal ball, all in one. Predictive models powered by AI can ingest vast amounts of financial data – stock prices, economic indicators, news sentiment, and more – to forecast market trends or investment risks with remarkable accuracy.
Use cases:
- Tasks that traditionally took intense manual modeling, like valuing a complex portfolio or identifying fraudulent transactions, can be automated.
- AI can evaluate a company’s financial statements, compare them with industry trends, and flag inconsistencies or red flags quicker than an army of analysts.
- Some investment firms already use AI to dynamically adjust portfolios – something that was very labor-intensive before.
Financial analysts can spend more time devising strategy and less time number-crunching. As a financial professional, you might combine a few tools: perhaps use an AI-driven data source for market signals and then feed that into your spreadsheets or BI tool for further analysis.
Recommended tools and platforms
- Bloomberg’s Alpaca or Refinitiv Eikon that integrate AI to filter news and data for traders and analysts
- Even without big-budget systems, you can use more accessible tools like Microsoft Power BI and Tableau both have AI capabilities (for example, Power BI’s “Quick Insights” will automatically analyze your dataset and provide findings)
- IBM Cognos Analytics is another business intelligence platform that includes AI suggestions for exploring data
- For forecasting and planning, tools like Anaplan or Adaptive Insights are starting to embed AI to improve projections.
- If you’re into coding a bit, Python with libraries like scikit-learn or Facebook’s Prophet can let you build custom predictive models on your data (but that requires more skill).
- Fintech-specific AI services, e.g., Kavout (an AI platform for stock analysis) or Zest AI (for credit risk scoring).
For HR professionals
IBM developed an AI model that can predict with 95% accuracy which employees are likely to quit in the near future. HR might not be the first area you think of for analytics, but it’s increasingly data-driven and AI is making a big impact.
Use cases:
- AI tools can scan hundreds of resumes in seconds, shortlisting candidates that best match a job profile without bias creeping in (as long as the AI is well-trained).
- They can conduct initial screening interviews via chatbots, asking structured questions and evaluating responses.
- Beyond hiring, AI helps in talent analytics – identifying patterns in employee performance, engagement surveys, or even email communication (in aggregated, privacy-respecting ways) to gauge morale.
- One powerful use is predicting employee turnover like done by IBM mode.
- AI can also assist with workforce planning: forecasting how many people with what skills you’ll need in 6 months or a year, based on trends.
What used to be a reactive “our annual survey shows people are unhappy, now what?” can turn into proactive retention strategies driven by continuous AI monitoring. Of course, HR professionals add the human touch, interpreting these insights and taking action with empathy, but AI ensures no important signal is missed in a sea of data.
Recommended tools and platforms
- Workday (a popular HR management system) has predictive analytics that can flag flight-risk employees or suggest career development plans using AI algorithms.
- SAP SuccessFactors similarly has embedded analytics to, for example, help identify factors impacting employee turnover.
- For hiring, tools like LinkedIn Talent Insights use AI to map talent pools and give data on where you can find certain skills
- Services like Eightfold.ai can analyze resumes at scale to find the best matches, reducing bias by focusing on skills.
- Visier is a well-known people analytics platform that offers out-of-the-box AI analyses on HR data (like identifying causes of attrition or forecasting staffing needs).
- If you’re in a smaller company or on a budget, even something like Google Forms + Google Sheets can incorporate simple AI. Google Sheets has an “Explore” feature that uses AI to automatically create charts or insights from your data (like survey results).
- IBM’s Watson Analytics for Social Media (now part of IBM Cognos) can analyze employee feedback text for sentiment and key themes.
- HR folks might also leverage AI chatbots (e.g., for answering common employee queries about benefits), which free up time and also provide analytics on what questions are common or where policies might be unclear.
For doctors and medical professionals
Modern healthcare is awash with data – patient records, lab results, medical images, research papers – and no single human can process it all. AI to the rescue.
Use cases:
- AI-powered diagnostic tools can analyze medical images (like X-rays, MRIs, CT scans) with high accuracy, often catching details that might escape the human eye. For instance, AI systems have been developed that can detect early signs of diseases such as certain cancers or diabetic retinopathy in eye scans, sometimes even earlier or more reliably than expert physicians (when used as a second pair of eyes). In practice, this means a doctor could receive an AI’s analysis alongside their own, like an automated second opinion highlighting “possible tumor here” or “90% likelihood of pneumonia in this chest X-ray.”
- AI can also sift through volumes of medical research faster than any individual. Imagine inputting a patient’s rare combination of symptoms into a system that then cross-references millions of medical journal articles and clinical trial results to suggest a potential diagnosis or treatment plan. IBM’s Watson, for example, was used to analyze a cancer patient’s genetic data and medical literature – it found a rare diagnosis that the medical team had missed, all in a matter of minutes.
- “Smart” hospital systems use AI to watch patient vital signs in real time and can alert staff of a patient’s deterioration or risk of sepsis hours before it would otherwise be apparent.
- AI-driven patient risk scoring can be done. For instance, some EHR (Electronic Health Record) systems can have predictive models that will score patients on likelihood of readmission or risk of complications, so clinicians can intervene early.
AI acts as a tireless medical assistant: crunching data, offering evidence-based suggestions, and flagging anomalies, which allows healthcare professionals to make more accurate and timely decisions for better patient outcomes.
Recommended tools and platforms
Many AI tools in healthcare are integrated into devices or hospital software, but there are still ways individual practitioners can take advantage. You might not “implement” a large AI system yourself, but you can pilot these tools in your practice, or use any that are available to you (like diagnostic support apps or wearables data analytics) to complement your care decisions.
- Radiologists can use AI-enhanced imaging software like Aidoc or Zebra Medical Vision which automatically highlights potential issues in scans.
- Tools like UpToDate Advanced now include an AI-driven differential diagnosis generator: you input patient findings and it suggests possible conditions to consider.
- Apps and platforms, like Arterys can analyze MRI images or Viz.ai for can detect strokes from CT scans. These AI assistants can be integrated into workflow.
- On the administrative side, BI tools (like Power BI, etc.) can help find patterns in patient data (e.g., AI might flag that ER wait times correlate with a certain time of day or patient demographic, which you hadn’t realized).
- Tools like Semantic Scholar can be used to include AI to summarize findings or highlight influential papers given a query.
For sales professionals
Sales is increasingly about smart timing and personalization: areas where AI shines.
Use cases:
- AI-driven lead scoring. Rather than relying on gut instinct or a hunch about which prospects are promising, AI can analyze historical customer data and behaviors to rank leads by their likelihood to convert. This means a sales rep gets a prioritized list (“Call these 10 customers first, because based on the data, they’re the hottest opportunities”), which dramatically improves efficiency.
- Sales forecasting. AI can crunch years of sales data, seasonality, and even macro factors and find complex patterns humans might miss and continuously learn, leading to steadily improved predictions. This helps managers set more realistic targets and manage inventory or resources.
- Real-time sales guidance. For example, AI-powered software can listen to sales calls (via transcripts) and, in real time, prompt a rep with useful info – “The client just mentioned budget concerns; mention our financing options” – or later analyze call patterns to coach the rep on what worked or didn’t.
- AI chatbots to handle initial customer inquiries. These can free up reps to concentrate on closing deals. And when it comes to upselling or cross-selling, AI can suggest products to pitch based on a customer’s purchase history and similar customer behaviors.
Recommended tools and platforms
- Salesforce’s Einstein AI can do things like automatically log activities, prioritize leads, forecast sales, and even analyze sentiment in emails
- HubSpot has similar AI-driven lead scoring and email response suggestions.
- Gong and Chorus.ai are popular tools for those who make a lot of calls. They record sales calls and use AI to analyze them, picking out customer pain points, competitor mentions, and effective vs. ineffective phrases
- Microsoft Dynamics 365 (CRM) also has AI insights
- Google Analytics combined with an AI recommendation engine can help better run an online store (for instance, Shopify has plugins that use AI to recommend products to customers, which can boost sales)
- Personal sales assistants like Tact.ai sit on top of CRM and use AI to give reps a conversational interface (like you can ask, “What’s the next best action for me today?” and it will respond with prioritized tasks)
- For simple needs, something like setting up an IFTTT automation or using a voice assistant with AI (e.g., “Alexa, ask CRM how my pipeline looks this week”) can be a small way to bring AI convenience into your day
These applications and tools barely scratch the surface, but they show that whether you’re a marketer, in finance, HR, healthcare, sales, or other fields, there are AI solutions designed for you. Start with one that aligns to your biggest pain point. Remember: the fanciest tool isn’t always the best – the one you will actually use regularly is the winner.
Checklist for AI Analytics Implementation
Use this quick-reference checklist to ensure you’ve covered all critical factors for successful AI analytics implementation:
Data readiness
- We have clean, comprehensive data for our AI use cases
- Our data sources are integrated (eliminating silos)
- We can access required data in a timely manner
- We have processes to maintain data quality going forward
Technology selection
- We’ve chosen AI/ML models appropriate for our specific needs
- Our infrastructure can support AI workloads (compute, storage, etc.)
- We have integration plans for existing BI tools and workflows
- We’re rigorously testing and validating models before deployment
People & organization
- We have executive sponsorship and clear business support
- We’ve identified champions across different departments
- Our teams have the necessary skills (or training plans)
- We’ve communicated the purpose and benefits of AI analytics
Project management
- We’ve prioritized high-impact use cases for initial pilots
- We have clear success metrics and KPIs for each initiative
- We’ve established realistic timelines and resource requirements
- We have a rollout plan that includes training and change management
Governance & ethics
- We have guidelines for responsible AI use
- We’ve addressed data privacy and security requirements
- We’ve considered potential bias in our models and data
- We have processes for ongoing monitoring and maintenance
By working through this checklist, you’ll set the stage for successful AI-powered analytics implementation. I’ve found that organizations that methodically address each of these areas are far more likely to realize the full potential of their AI investments.
Final thoughts
The trajectory is clear: AI-accelerated analytics is becoming the new normal for organizations that aim to be data-driven. The convergence of AI and analytics is enabling decisions that are faster, smarter, and more predictive than ever before.
The future of analytics is one where insights are instant, decisions are augmented by algorithmic intelligence, and every employee can leverage data like a seasoned analyst. Achieving that future isn’t an overnight journey, but the steps taken today will determine who leads in the data-driven economy of tomorrow.


